April Edition 2024

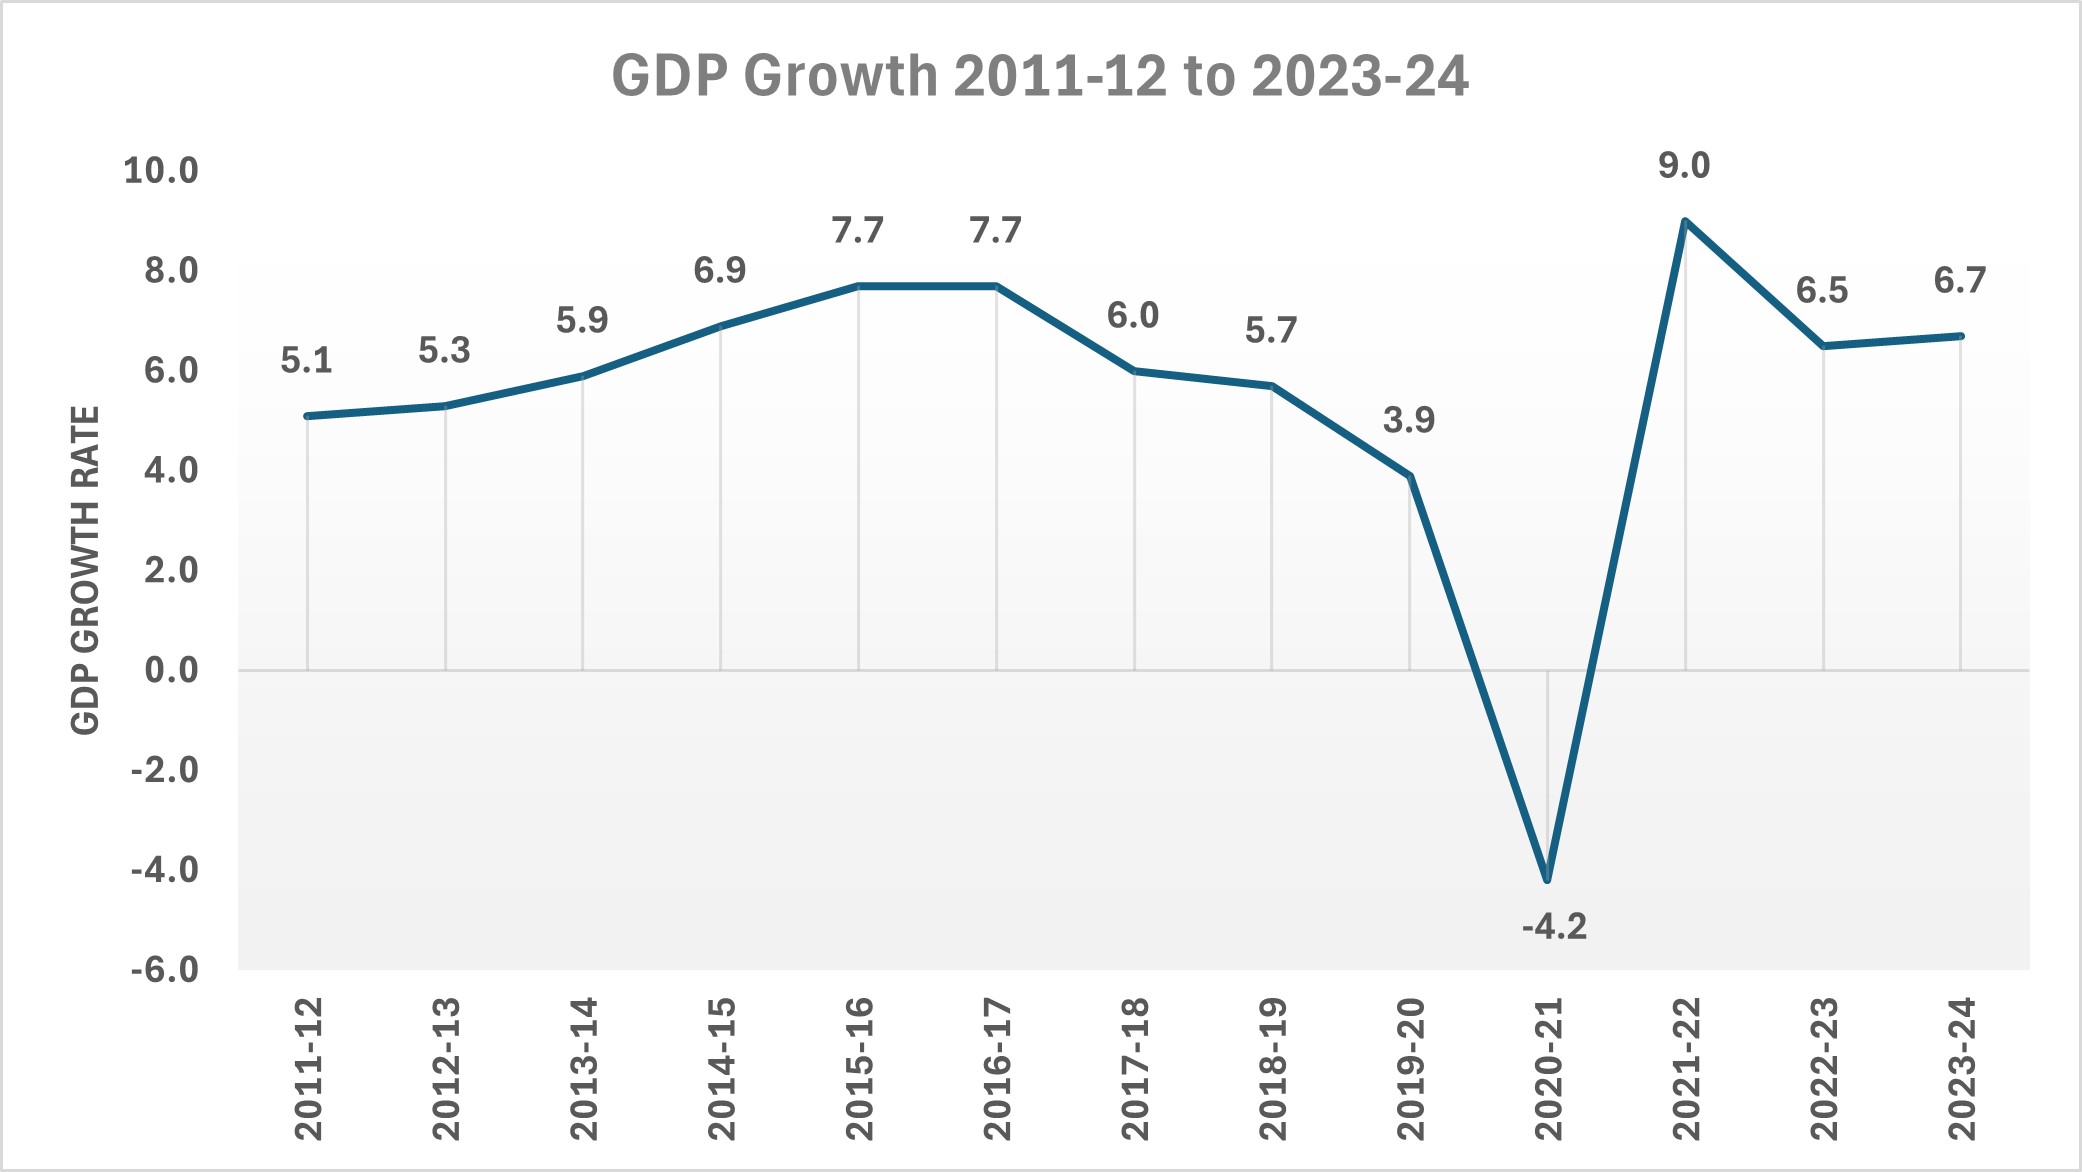
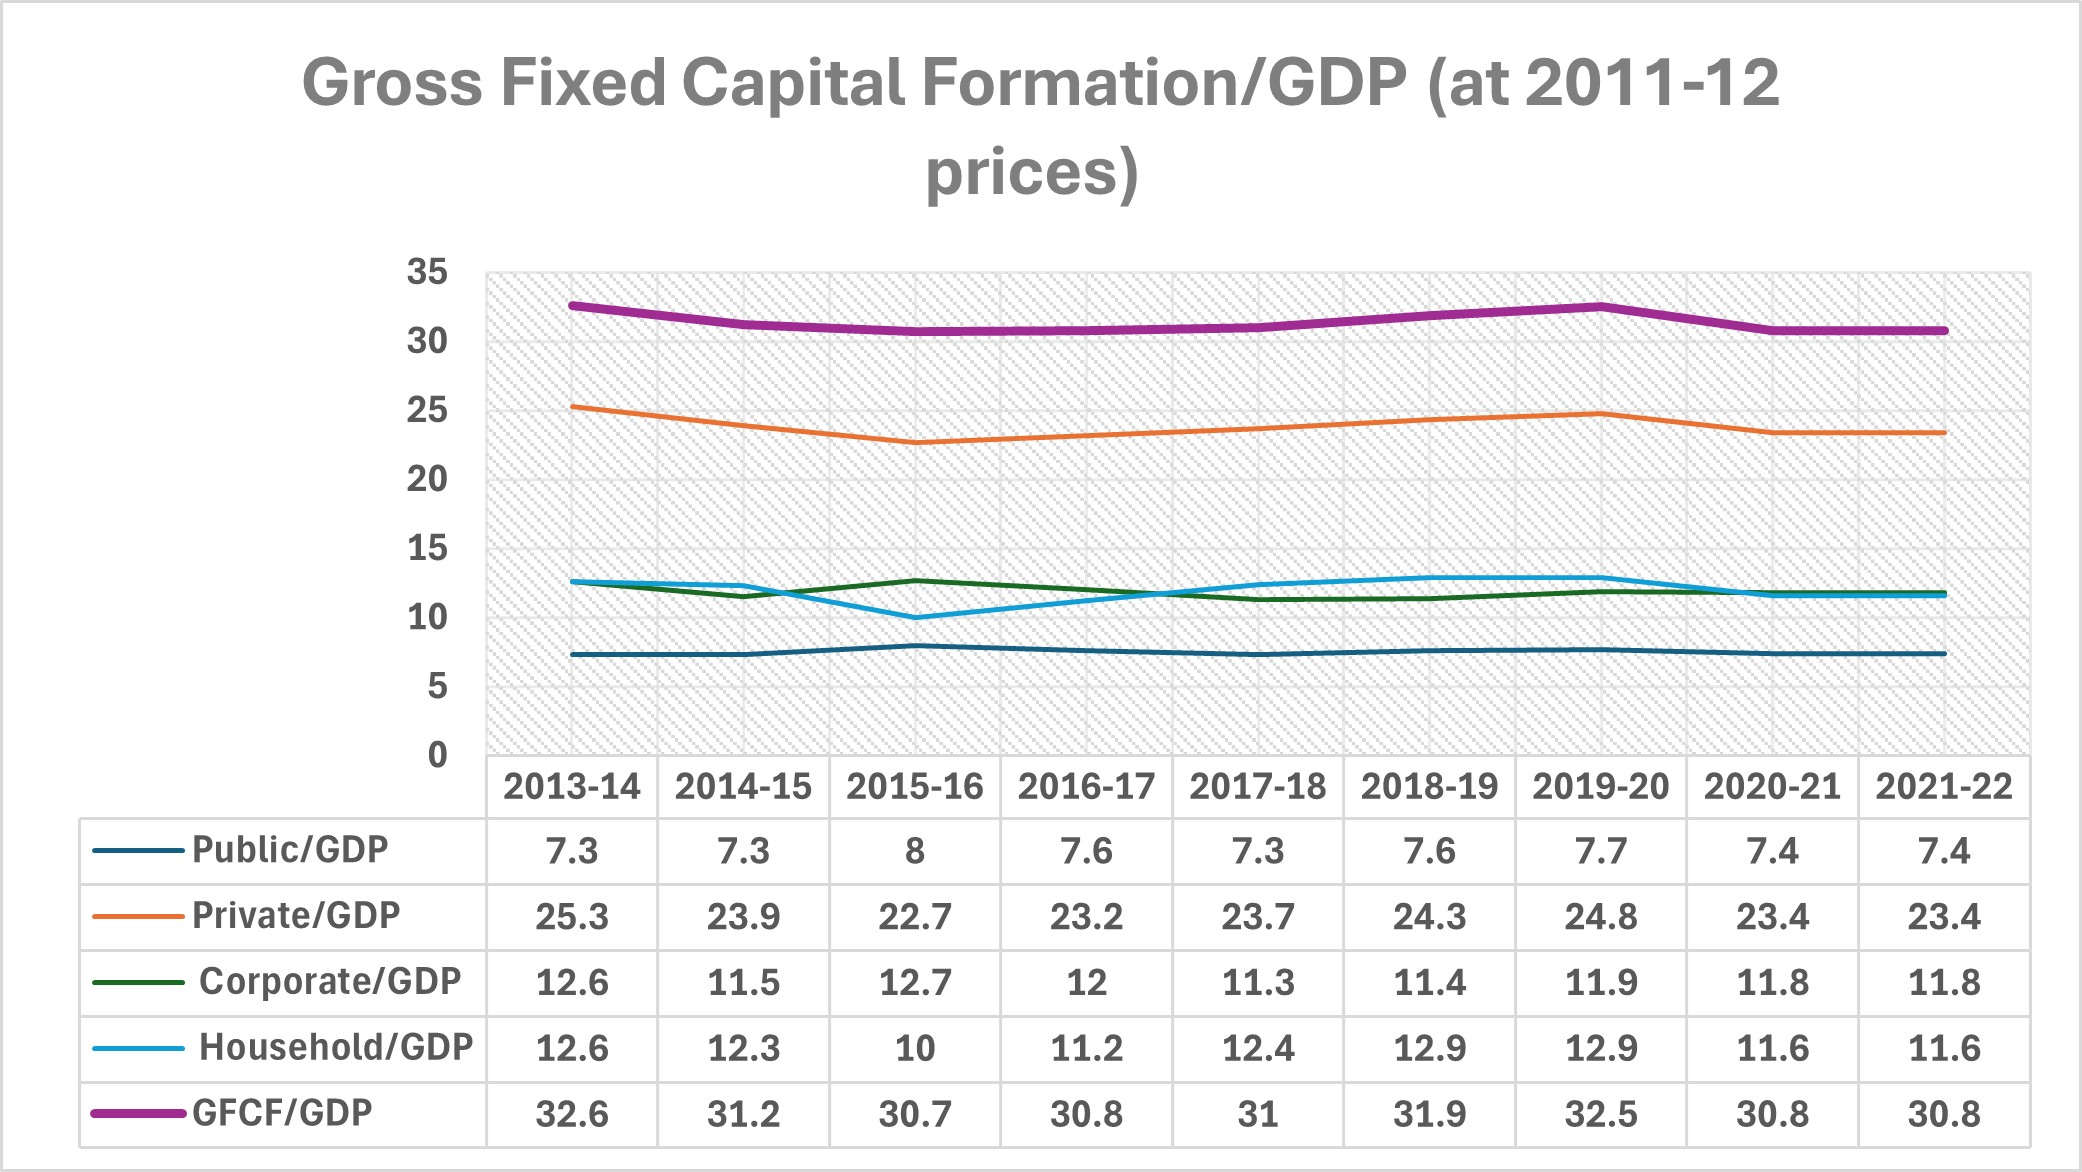
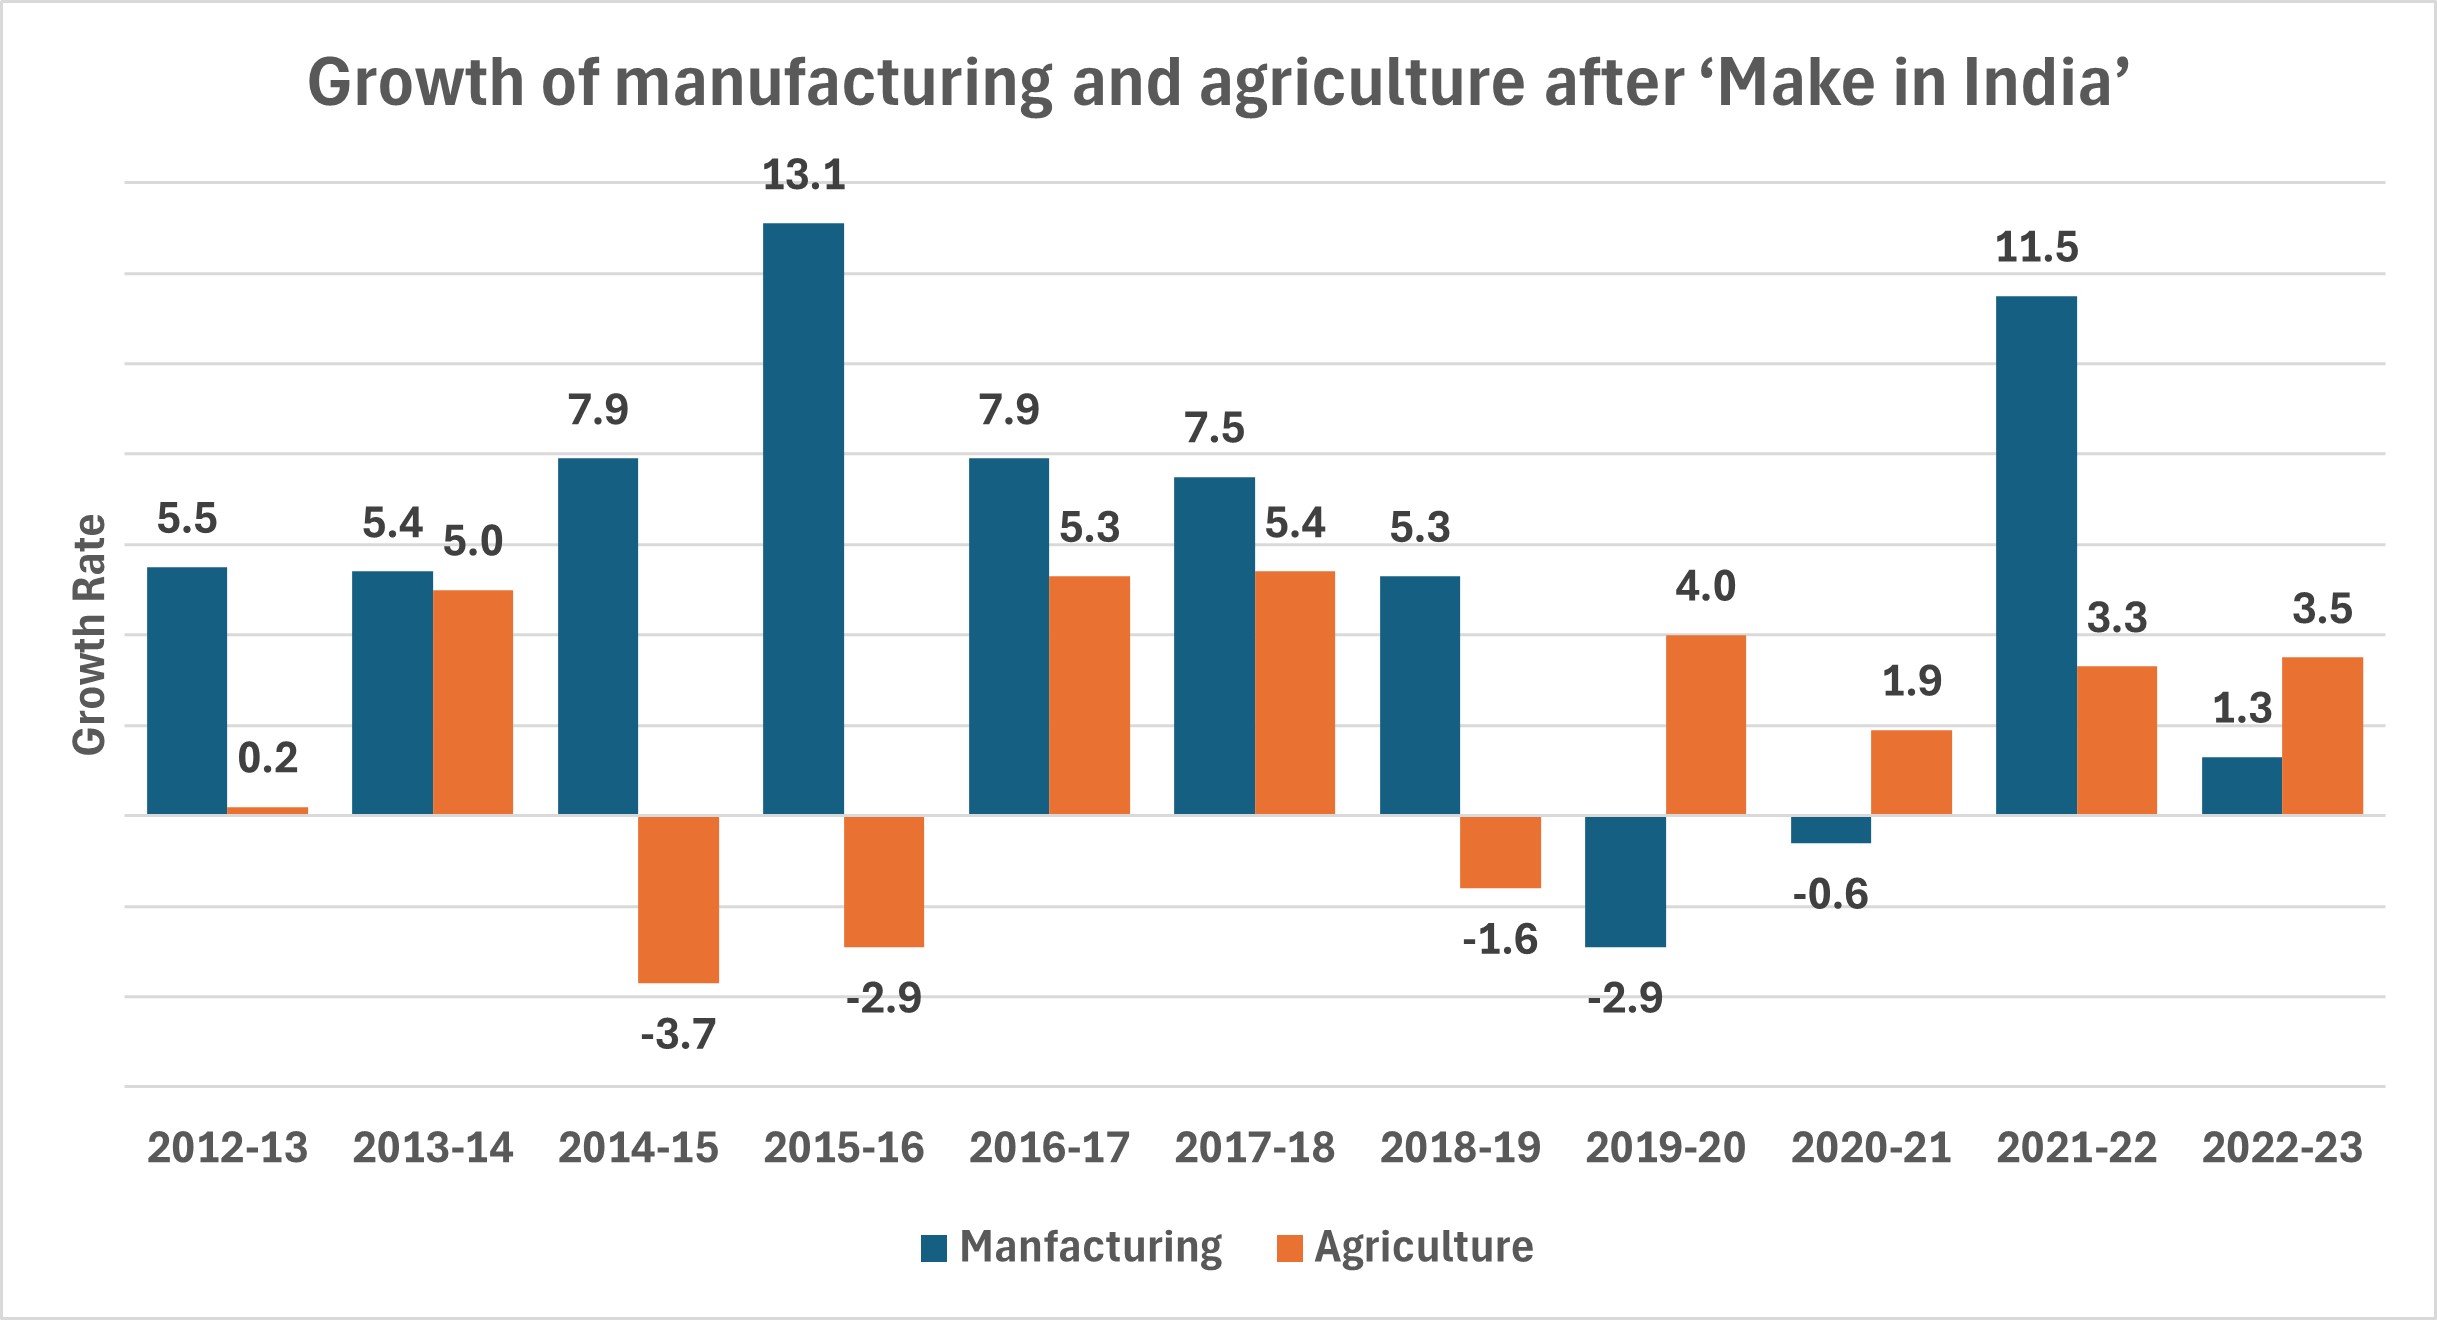
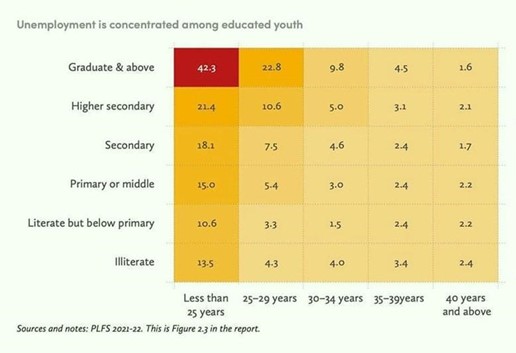
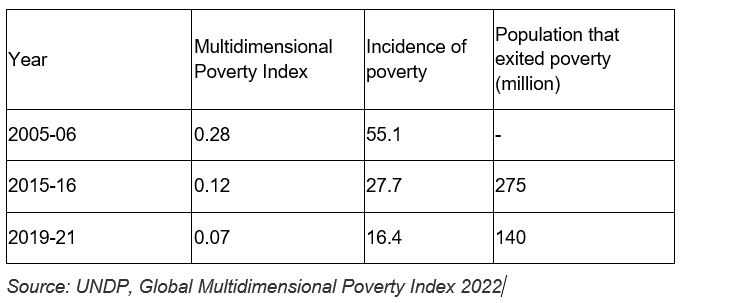
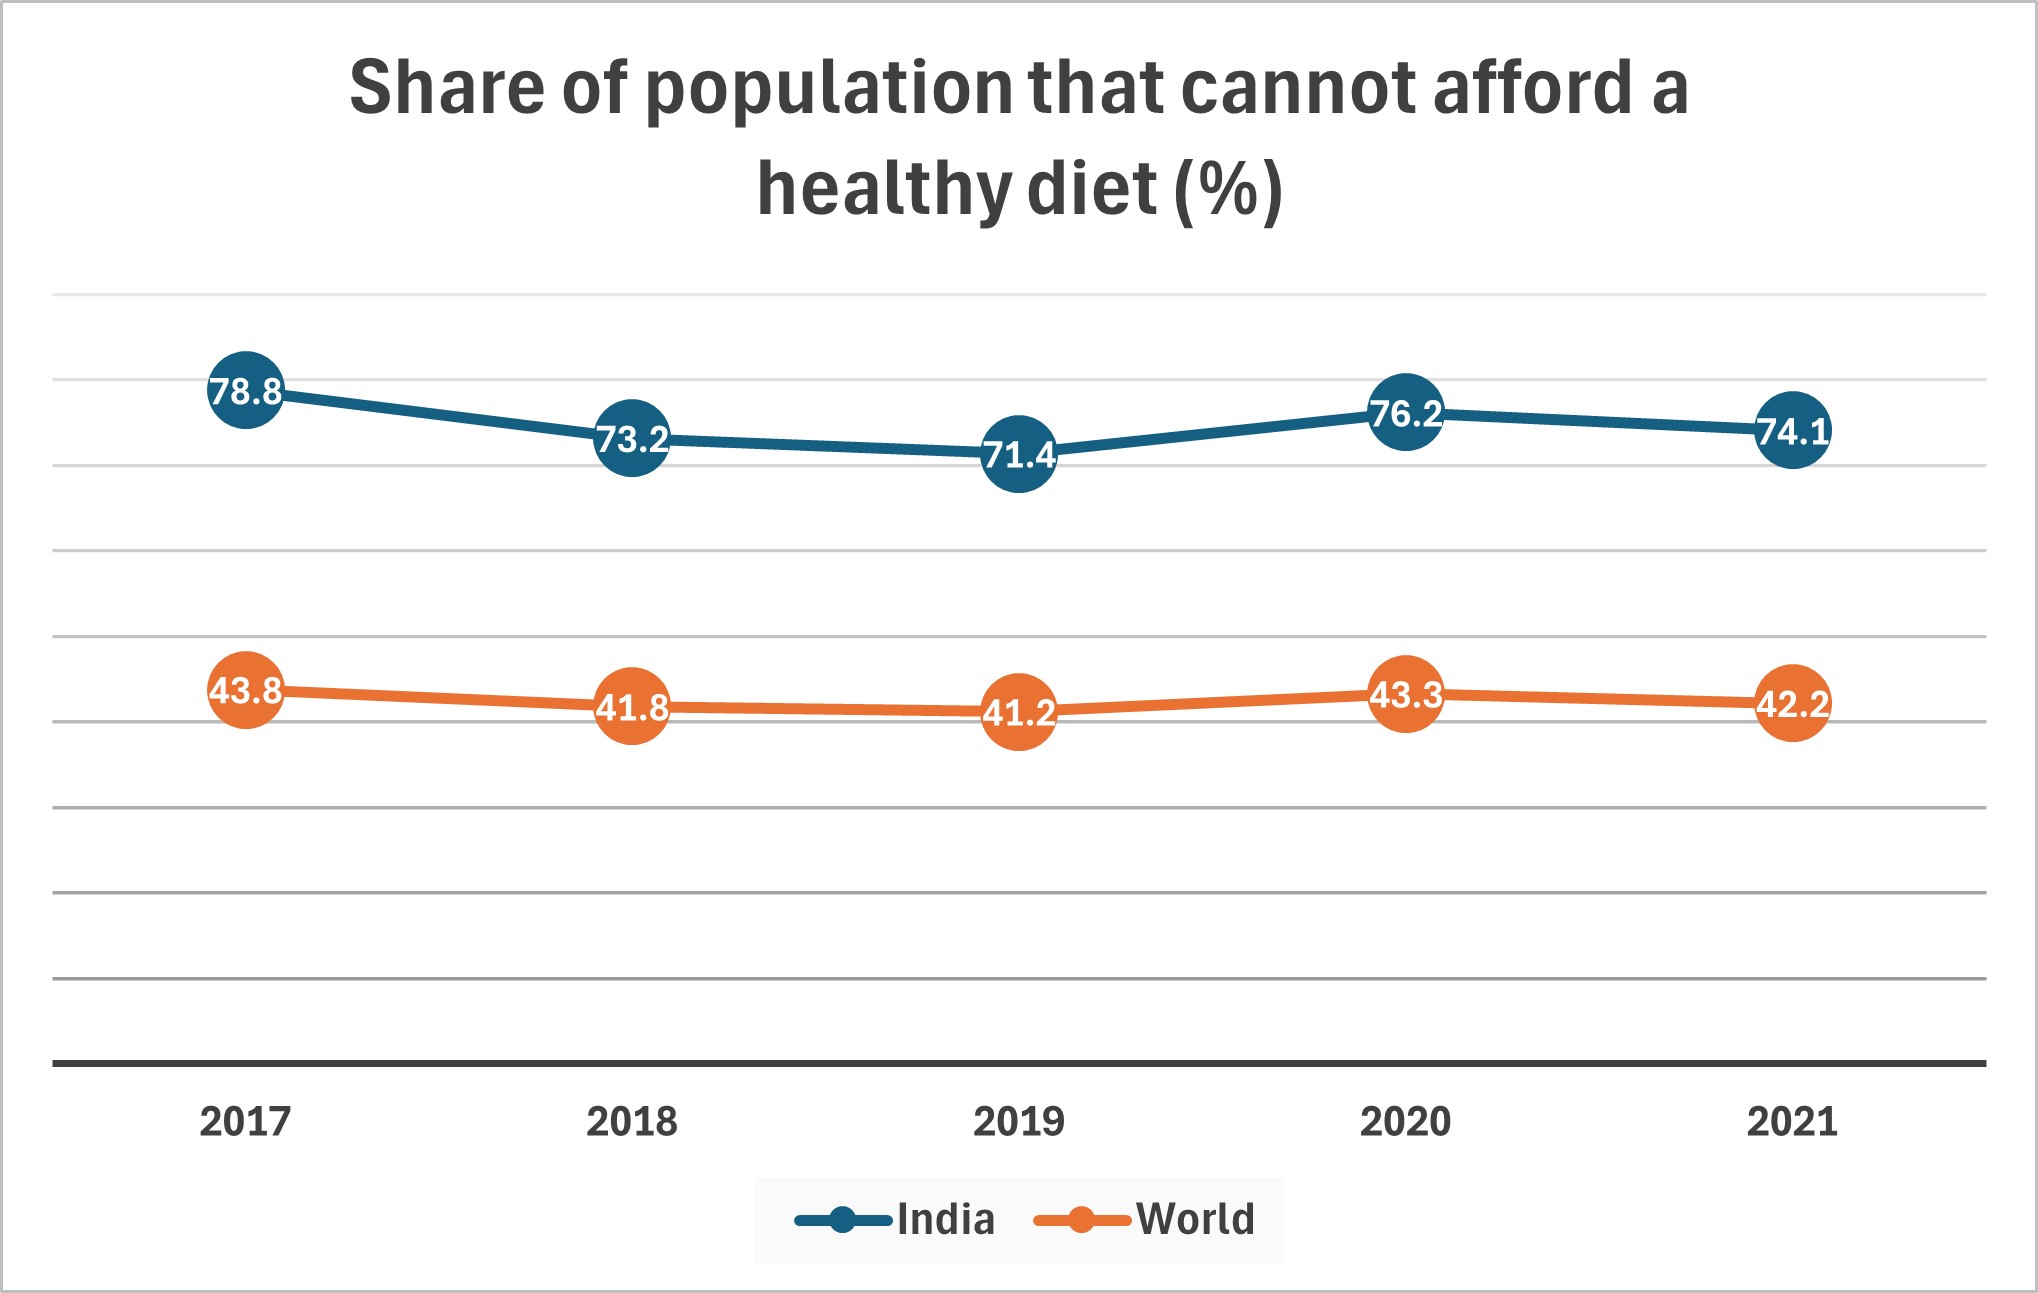
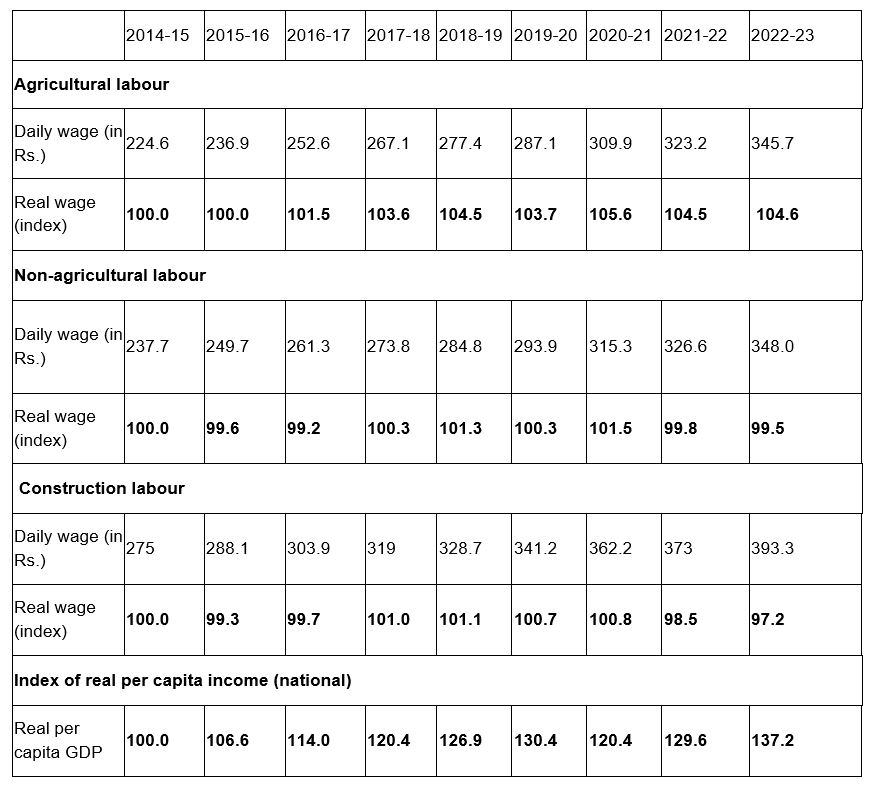
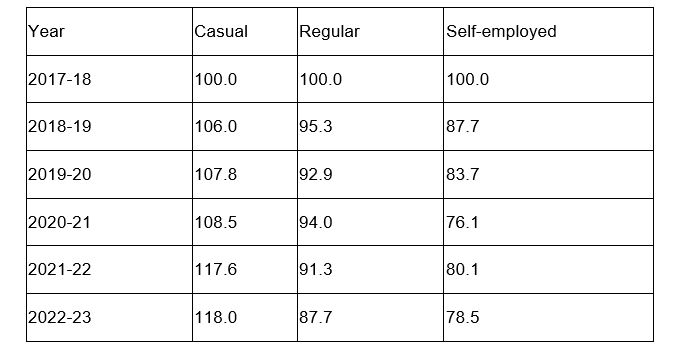
The NDA government came to power under Mr. Narendra Modi in 2014, and they were re-elected in 2019. The key pillars of Mr. Modi’s campaign have been Achche Din (better days), Sabka Saath, Sabka Vikas (inclusive development), and Na Khaunga aur Na Khane Dunga (eliminate corruption). With electoral bonds declared unconstitutional and numerous analyses now available in the public domain demonstrating how electoral bonds were used for extortion, money laundering, and quid pro quo deals, the narrative of “Na Khaunga aur na Khane denge” has unraveled. Let us take a closer look at the first two narratives. Let us look at the state of Achche Din through the following parameters: economic growth, employment status, poverty, and food security GDP growth since 2011 The government claims that GDP growth over the last ten years demonstrates the success of its economic policies, which have helped 140 crore Indians live better lives and create a Viksit Bharat. But a closer look at economic growth since 2011, in terms of GDP, reveals another story. Note: Figures are of gross value added (GVA) at basic prices, in constant (2011–12) prices Key observations: The reality of post pandemic economic recovery The government has claimed that we are witnessing a robust economic recovery following the pandemic, demonstrating the strength and potential of the Indian economy. This does not hold up under closer scrutiny. In reality, this recovery is merely a rebound from the contraction caused by the pandemic. As shown in the chart and data below, the investment rate, Gross Fixed Capital Formation (GFCF), has not increased since 2014. Key observations: The Modi government came to power with the promise of creating two crore jobs per year. The actual numbers say a different story. Unemployment Rate As shown in the chart below, the unemployment rate, a standard criterion used to assess an economy’s performance, remained higher during Modi’s tenure than in previous years. Note: A continuous data series on both UR and WPR is available only from 2017-18 onwards. Data are for usual (employment) status. Key Observations Impact of ‘Make in India’ “Make in India” is a flagship programme Narendra Modi launched in 2014 to facilitate investment to build best in class manufacturing infrastructure in India. The programme has a strategic intent of inviting global corporations to manufacture in India and thereby providing a fillip to foreign direct investment. It aims to create 100 million additional jobs and raise the manufacturing sector’s contribution to GDP to 25%. But data shows that “Make in India” did not lead to growth of manufacturing and has had no significant impact on India’s economic growth during last decade: Key Observations Unemployment status grouped by age The data from the Periodic Labour Force Survey (2021-22) shown below demonstrate the dire state of employment in India. The government did not release the status of the National Sample Survey Organization (NSSO) survey conducted in 2017–18 as it would not have supported its narrative for the 2019 elections. Ever since, there has been no authentic measure of consumption poverty. The consumption expenditure survey conducted by NSSO has historically been the most authentic way to measure poverty. Multidimensional poverty index The multidimensional poverty index produced by the United Nations Development Programme (UNDP) shows the deprivation index of individuals. As per the table below, the rate of decline is not greater than what it has been since 2005. Additional Observations: Food security As per the data issued by Food and Agriculture Organisation (FAO), 75% of the population cannot afford a healthy diet. Source: FAO (2023) Key Observations Income and wealth distribution What is the status of income and wealth distribution or inclusive growth, as the slogan “Sabke Saath Sabke Vikas” claims? A growing economy must be inclusive; however, the absence of official data indicate that our government doesn’t keep track of this metric. Even in the World Inequality Report, entries for India end with the year 2019. Table below provides indicators of income and wealth distribution. The distribution is calculated using the data on wages in India. Surprisingly, there is no such data available for women. Sources: (i) The real wage has been calculated from Labour Bureau Data data on wages and the Consumer Price Index for agricultural workers published by the Reserve Bank of India (RBI). (ii) Real GDP data are from the National Accounts Statistics, Ministry of Statistics and Programme Implementation. Key Observations Growth of earnings The table below shows the movement in real incomes based on the Periodic Labour Force Survey (PLFS). Note: Earnings are indicated as index numbers, with the base year 2017-18 equal to 100. Key Observations References: The charts and / or the data for the charts and analysis are taken from the following articles. The complete article, along with detailed analysis, can be read by following these links. These articles are written by Dr. Pulapre Balakrishnan and Dr. M Parameswaran.Achche Din
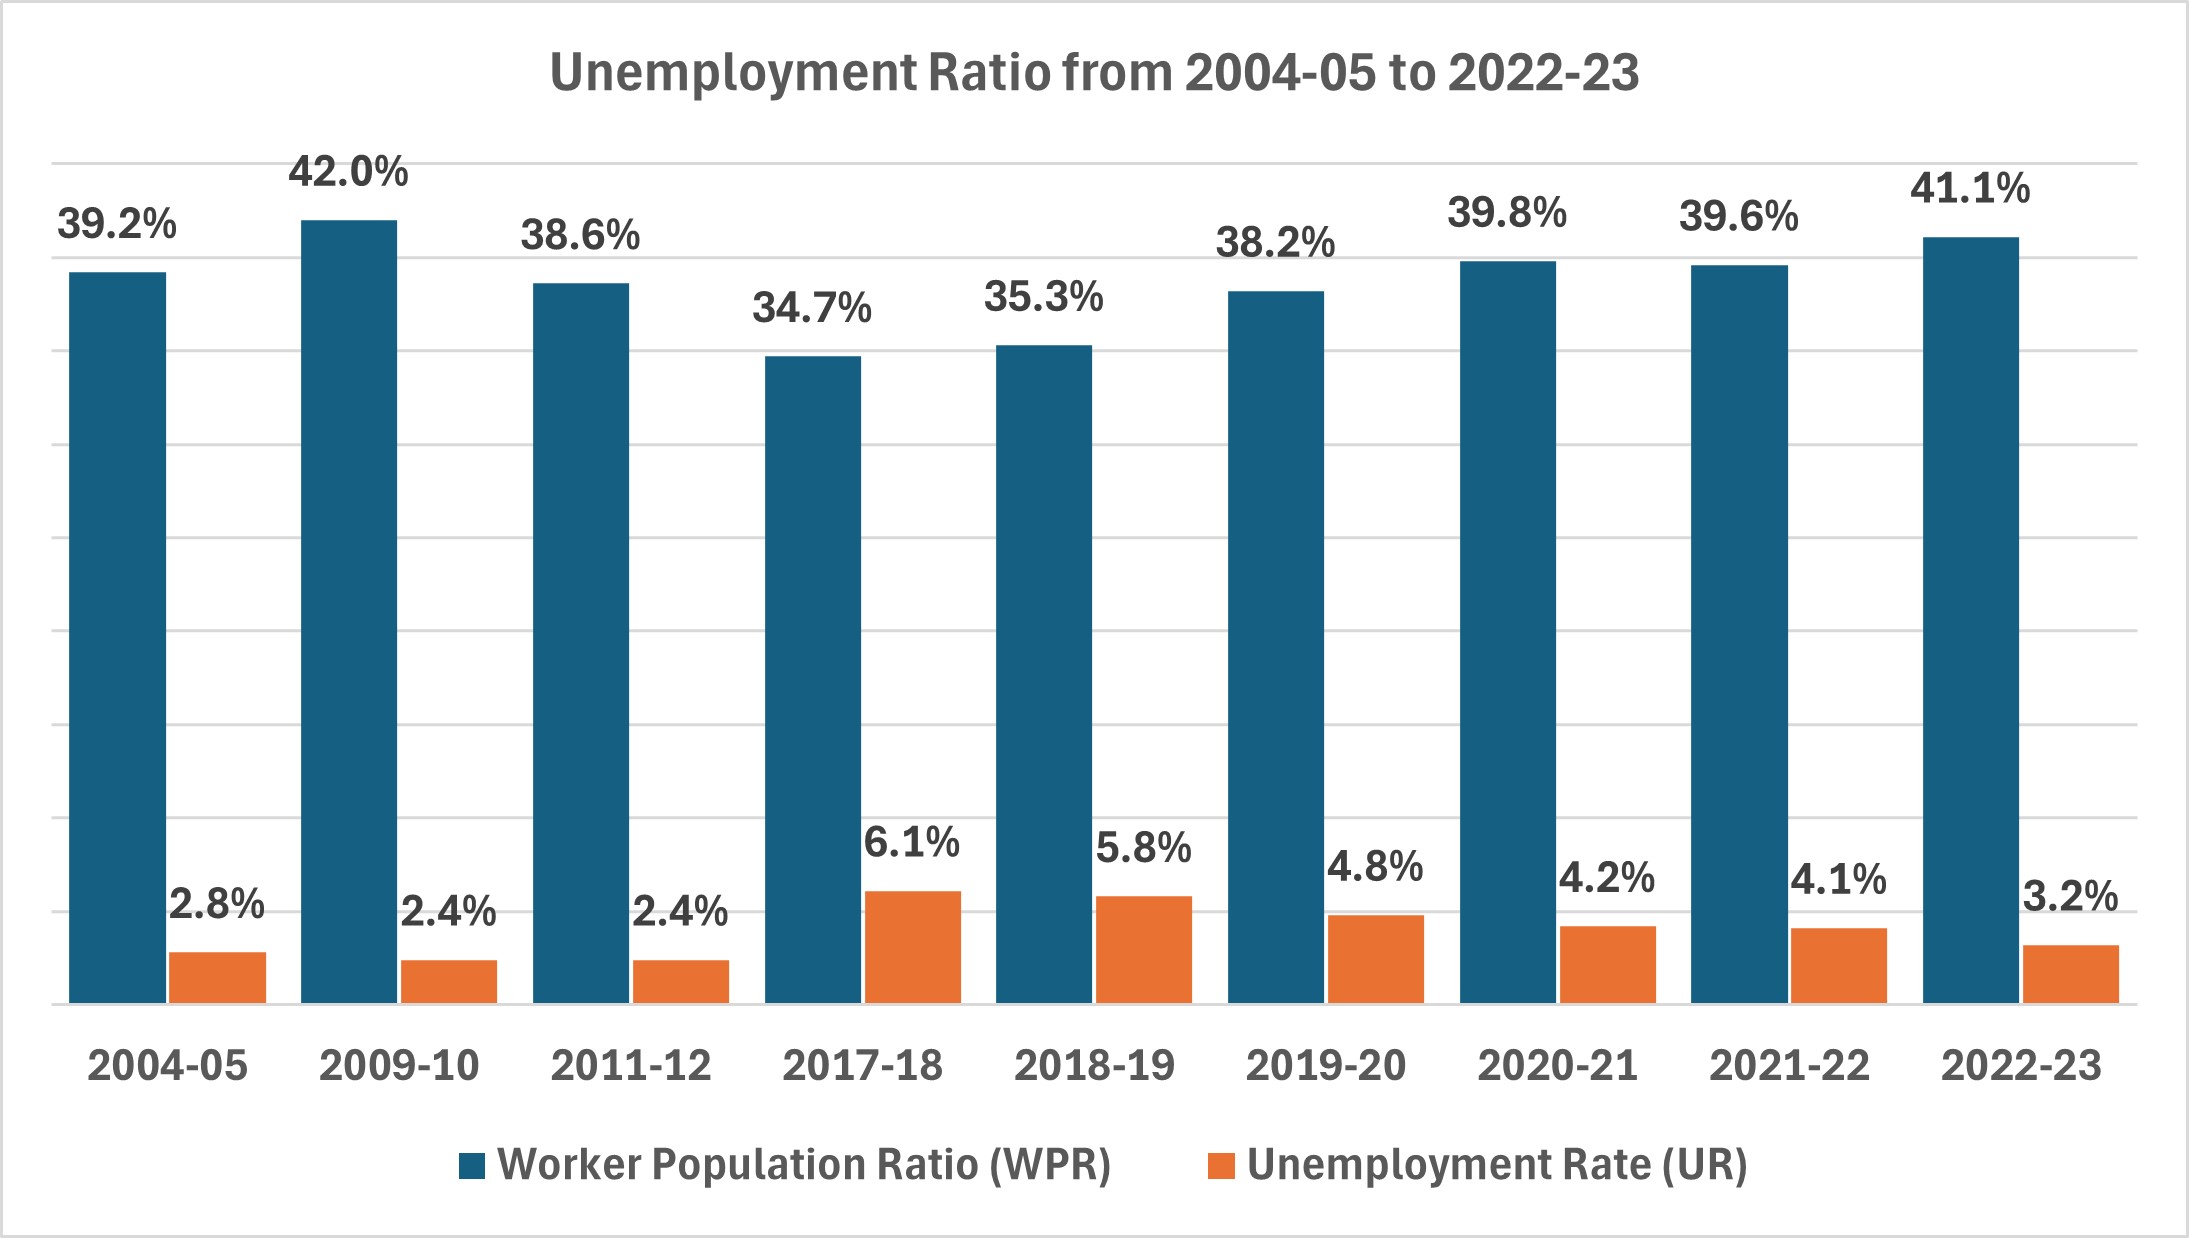
Source: WPR is from the Periodic Labour Force Survey (PLFS) for 2017-18. UR for the years up to 2017-18 is calculated from data in PLFS (2017-18). For later years, it is taken from subsequent annual issues of the PLFS.
The “Sabke saath Sabke vikas” story
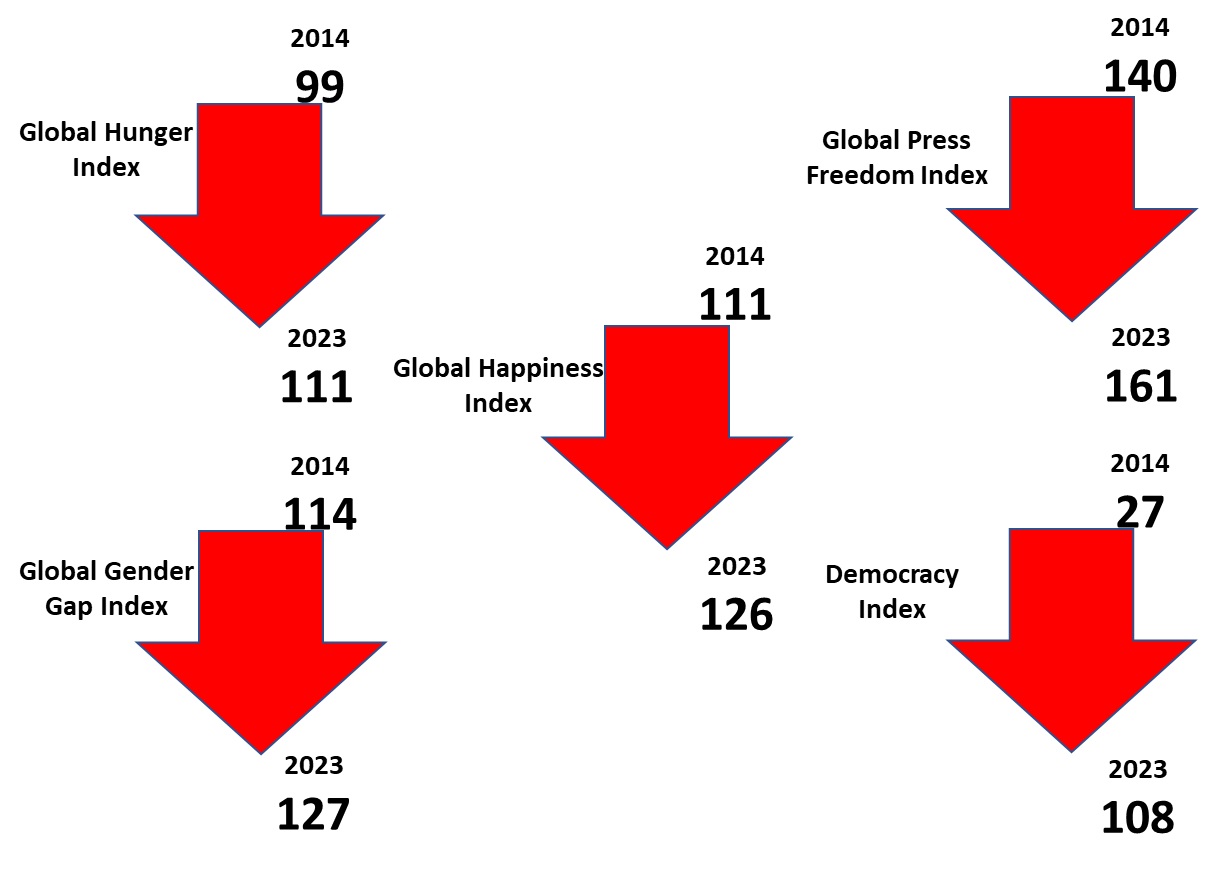
Drop in all major global indices.